In the world of finance and trading, success often hinges on the ability to accurately identify market trends. Understanding market trends is crucial for directional trading strategies, allowing traders to make informed decisions and capitalise on profitable opportunities. In this guide, we will delve into the methodologies, tools, and techniques essential for identifying market trends to create effective directional trading strategies.
Understanding Market Trends
Definition and Significance of Market Trends
Market trends represent the general direction in which a market or an asset is moving. They are crucial for traders as they offer insights into potential profit opportunities or risks. Trends come in various forms – primary, secondary, and minor – each influencing trading decisions differently.
Characteristics of Market Trends
- Types of Trends: Uptrends represent a continual upward movement in asset prices, marked by higher highs and higher lows, indicating a bullish market sentiment, essential in formulating directional trading strategies. Conversely, downtrends signify a persistent decline in asset prices with lower lows and lower highs, reflecting a bearish market sentiment crucial for establishing directional trading strategies. Sideway trends, known as ranging or horizontal trends, depict price movements within a confined range without a clear upward or downward direction, impacting the approach of directional trading strategies. On algorithmic trading platforms like uTrade Algos, there are predefined strategies called uTrade Originals, which are the result of extensive experience and research tailored to diverse market conditions. Once you know the trend in the market, you can use these strategies to your benefit.
- Factors Influencing Trends: Market sentiment represents the collective mood of market participants toward an asset, market, or economy, influencing buying or selling decisions and impacting trends. Economic indicators are statistical measures reflecting an economy’s health, affecting investor confidence and market trends. Geopolitical events, encompassing global political, social, or economic occurrences, significantly impact financial markets and influence trends.
- Trend Parameters: Trend strength measures the force behind consistent price movements, like a steep stock price surge indicating strong buying pressure in a robust uptrend. Trend duration marks how long a trend persists before reversing; a currency pair maintaining an upward trend for months signifies a prolonged uptrend. Volatility represents price fluctuation levels, higher during uncertain periods or sideways trends, seen in erratic stock price swings.
Methods and Tools for Identifying Market Trends
Technical Analysis Techniques
- Simple Moving Average (SMA): Calculates an average of closing prices over a set time, offering a smoothed trend line for identifying trend direction and potential support/resistance levels.
- Exponential Moving Average (EMA): Assigns greater importance to recent prices, responding faster to price changes than SMA, making it more suitable for short-term traders or identifying trend reversals.
- Moving Average Convergence Divergence (MACD): A momentum indicator showing moving average relationships, consisting of the MACD line (difference between short-term and long-term averages), signal line (EMA of MACD line), and histogram. It helps detect trend changes, momentum shifts, and buy/sell signals, notably through MACD line and signal line crossovers.
- Relative Strength Index (RSI): An oscillator measuring the speed and change of price movements, indicating overbought (above 70) or oversold (below 30) conditions, aiding in spotting potential trend reversals or corrections.
- Bollinger Bands: Comprising three lines – a middle line (SMA), upper band (usually two standard deviations above), and lower band (two standard deviations below) – gauging market volatility. Proximity to bands suggests overbought or oversold conditions and sudden movements outside the bands can indicate potential trend reversals.
- Chart Patterns: Chart patterns serve as confirmation tools for existing trends, vital for directional trading strategies. Patterns like ascending triangles or bull flags validate uptrends, whereas double tops or bottoms signal potential reversals, guiding directional trading strategies. Triangles, flags, and pennants indicate consolidation periods before continuation, offering insights into future price movements and influencing directional trading strategies. Additionally, the significance of patterns may differ based on the timeframe, emphasising the importance of considering multiple timeframes to validate patterns and their impact on the overall trend within directional trading strategies.
- Trendlines and Channels: Trendlines are drawn by connecting consecutive lows in an uptrend or consecutive highs in a downtrend. It shows the trend direction and potential support/resistance levels. Channels consist of parallel trend lines that are used to represent the trend direction and potential trading ranges within which prices fluctuate.
Fundamental Analysis
- GDP reflects economic output and growth, impacting market sentiment and consumer spending. Positive GDP often drives upward trends in stocks.
- Interest rates, controlled by central banks, influence borrowing costs and investments. Lower rates encourage borrowing, fostering bullish trends in equities and real estate.
- Employment data, like non-farm payrolls, boosts consumer confidence and drives economic growth, impacting market uptrends.
- News events and geopolitical factors create market uncertainty and volatility, influencing trends. Positive news supports bullish trends, while negative events may cause downtrends.
- Intermarket analysis studies correlations between asset classes, predicting potential trends and influences across markets.
- Market sentiment indicators, like VIX and put/call ratios, gauge fear and market sentiment, impacting trends.
- Social media and news sentiment analysis offer insights into prevailing market moods, anticipating trend shifts based on public perception and media reporting.
Strategies for Identifying and Riding Market Trends
- Trend-following strategies utilise moving average crossovers and Donchian Channels to identify trend continuations or reversals. While effective in capturing strong trends, they can produce false signals in ranging markets, leading to potential losses.
- Contrarian approaches involve identifying trend reversals using indicators like RSI and engaging in counter-trend trading for short-term profits, albeit against prevailing trends.
- Combination strategies blend technical, fundamental, and sentiment analyses for reliable signals, confirming identified trends for more accurate trading decisions.
- Diversification across multiple strategies, including both trend following and contrarian approaches, reduces overall risk exposure and allows capturing opportunities across diverse market conditions.
Risk Management and Implementation
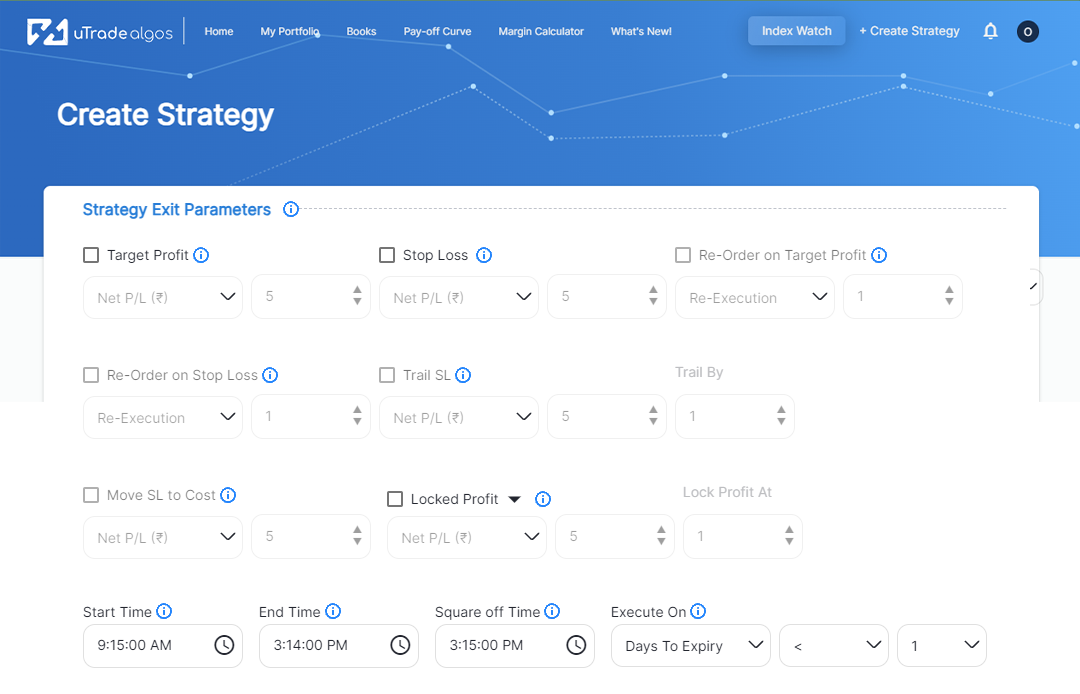
- Stop-loss Orders: Predefined exit points limiting potential losses and safeguarding capital when trades move unfavourably, set at specific price levels to minimise losses against the anticipated trend.
- Position Sizing: Determines trade capital based on risk tolerance, account size, and success probability, allocating a percentage of capital to control risk per trade.
- Risk-Reward Ratios: Assess potential gains versus losses, ensuring positive ratios by setting profit targets higher than stop-loss levels for favourable trade outcomes.
- Backtesting and Validation: Involves testing strategies with historical data to evaluate effectiveness across market conditions. Platforms like uTrade Algos provide accurate historical data for strategy backtesting. Adaptability is crucial, adjusting strategies to changing market dynamics, while ongoing validation ensures strategy efficacy through continuous monitoring and testing.
Effectively identifying market trends for successful directional trading strategies demands a multifaceted approach, integrating tools like moving average crossovers and Donchian channels. Risk management measures such as stop-loss orders and assessing risk-reward ratios ensure a disciplined strategy. Backtesting historical data and continuous validation enhance adaptability to market changes, which is crucial within algorithmic trading. Integrating these methods enables traders to astutely discern trends and devise effective strategies for navigating dynamic financial markets.

 November 13, 2023


