The all in one guide about the top 5 indicators that can make your trades a lot more reliable, systematic and higher the odds of withstanding different market scenarios.
While staring at the fluctuating charts and lines of any trading terminals, you might have wondered what these lines and shapes stand for and how an expert makes sense of it. Over and above this, most importantly, what are the best trading strategies? Well, the lines and shapes on trading charts are commonly called Indicators, and they help you analyze the price movement of the security.
While they may look complex and intimidating, once you understand them, indicators are one of the most important weapons in any successful trader’s arsenal. But to be a pro, it is essential first to understand the basics.
Understanding Trading Indicators
Trading indicators are tools used as a comprehensive guide to earning more gains, as they help us understand the market better. These indicators are mathematical calculations plotted as lines on the trading terminals, which help traders identify certain signals and trends within the market.
These indicators help the traders make better and well-informed decisions by providing key information about:
- The direction in which the trend is moving;
- Any momentum present in the investment market;
- Profit potentiality due to volatility in the share market;
- Forecast signals help in predicting future prices.
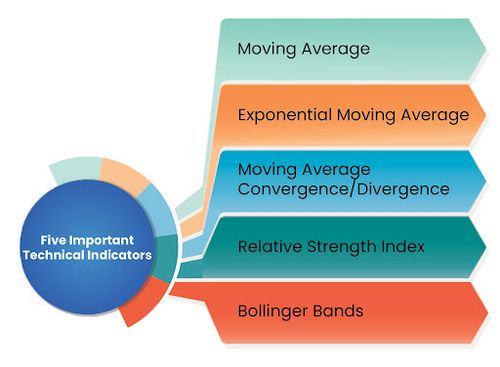
5 Important Technical Indicators that You Need to Know
There are dozens of indicators that can be displayed on the charts. Below is an outline of the most important technical indicators that one should know of. This said, you should always remember that your market knowledge and risk appetite are the best measures to decide which trading strategy suits you best.

- Moving Average (MA):
Remember studying average at school? The moving average is just an extended version of the same. It is a great tool for identifying a trading opportunity when it arises. It also helps to understand the trend in the market.
Average= Sum/Number of Items
Extending the concept to trading, Moving average is defined as the calculated average of the closing price of a particular security for any given time frame. It can be calculated from minutes, hours to years.
Sometimes, moving averages are also calculated using other parameters such as high price, low price, and opening price. However, traders and investors mostly use the closing price to reflect the price at which the market finally settles down.

In the above graph, the blue wavy line shows the moving average of the previous nine days at any given coordinate.
A simple application of the moving average is to identify the buying and selling opportunities of a particular security.
Whenever the stock price trades above its moving average price, it means more people are willing to trade in the particular security, and vice versa.
Using your knowledge, gut intuition and analysis, you can utilize information and develop your own trading system – our own trading system, which has your own set of rules to identify entry and exit points!!
- Exponential Moving Average
An exponential moving average (EMA) is a type of moving average (MA) that places a greater weight and significance on the most recent closing price as compared to the moving average, which gives equal weightage to all observations in the period considered.
EMA = Closing Price x Multiplier + EMA (Previous Day) x (1-Multiplier)
Multiplier = [2 ÷ (Number of days + 1)]
Let’s consider the chart below for NIFTY plotted with nine days MA and five days EMA.

The red curve stands for MA, and the blue one for EMA. From the chart, it is clearly visible that EMA is more reactive to the prices and sticks closer to the <which?> price.
EMA is quicker than MA to react to the current market price, which helps the trader make quicker trading decisions.
- Moving Average Convergence/Divergence (MACD)
MACD is a technical analysis indicator which shows the relationship between the two exponential moving averages of security. It aims to identify changes in a share price’s momentum. It is the best indicator for intraday trading.
It helps traders identify possible opportunities around support and resistance levels.
As the name suggests, convergence means that two moving averages are coming together, while divergence means that they’re moving away from each other.
When calculating the MACD, only two lines are taken into consideration – the MACD line and the signal line.
MACD = 26-period EMA – 12-period EMA
Signal Line = 9-period EMA

If the MACD cuts through the signal line from below, traders could use it as a buy signal, and if it cuts the signal line from above, then it could be used as a sell signal.
The MACD indicator is so widely used because it is simple and reliable. Its popularity comes from the two different signals that it gives; the strength of the trend and the turning point of the trend.
- Relative Strength Index (RSI)
RSI is a momentum indicator to measure the magnitude of price change. It is one measuring unit that helps traders understand when a stock is overbought or oversold. It is also the best indicator for options trading.
Market momentum is measured by continually taking price differences for a fixed time interval. To construct a ten-day momentum line, simply subtract the closing price ten days ago from the last closing price. This positive or negative value is then plotted around a zero line.

RSI helps traders to identify market conditions and also warns of dangerous price movements. It is expressed as a figure between 0 and 100.
An overbought asset is generally around level 70, while an oversold asset is near 30.
An overbought signal suggests that short-term gains may be reaching a point of maturity and assets may be in for a price correction. In contrast, an oversold signal could mean that short-term declines are reaching maturity and assets may be in for a rally.
The RSI indicator value is calculated using the following formula:
RSI = 100 – {100 / (1 + RS)}
RS = Average Gains over x periods / Average Losses over x periods
The average gain or loss used in the calculation is the average percentage gain or loss during a look-back period.
Let’s understand this with an example:
Imagine the market closed higher seven times out of the past 14 days with an average gain of one per cent. The remaining seven days all closed lower – with an average loss of −0.8 per cent.
The calculation for the first part of the RSI would look like the following expanded calculation:
RSI=100-[100/{1+(1*14/-0.8*14)}]
The second step of the calculation smooths the results.
RSI=100-[100/1+{(Previous Average Gain*13)+Current Gain}/(Previous Average Loss*13)+Current Loss}
Essentially, the RSI is a calculation of the profitable price closes relative to unprofitable price closes, reflected as a percentage.
As the indicator value is reflected as a percentage, it will move between 0 and 100.
- Bollinger Bands
Bollinger Bands is one of the popular technical analysis tools, where three different lines are drawn, with one line below and one above the moving average line. Its specific period moving average is denoted as midline to form an ‘envelope’.
These lines show a band or a volatility range in which a particular security price is moving up or down.
Bollinger Bands show the levels of different highs and lows that a security price has reached in a particular duration and also its relative strength, where highs are near the upper line and lows are near the lower line.
The bandwidth widens and narrows depending on volatility. If it’s high, the band will widen, and vice versa. These bands show oversold and overbought conditions in relation to a selected time period moving average.

Before applying these indicators in your trading strategy, remember that you should never use an indicator alone or use too many indicators at once. Use these technical indicators alongside your own assessment and due diligence.
Of course, there are millions of trades that take place every day. Think about an individual stock. Every minute there is a trade that gets executed on the exchange. As market participants, do we need to keep track of all the different price points at which a trade is executed?
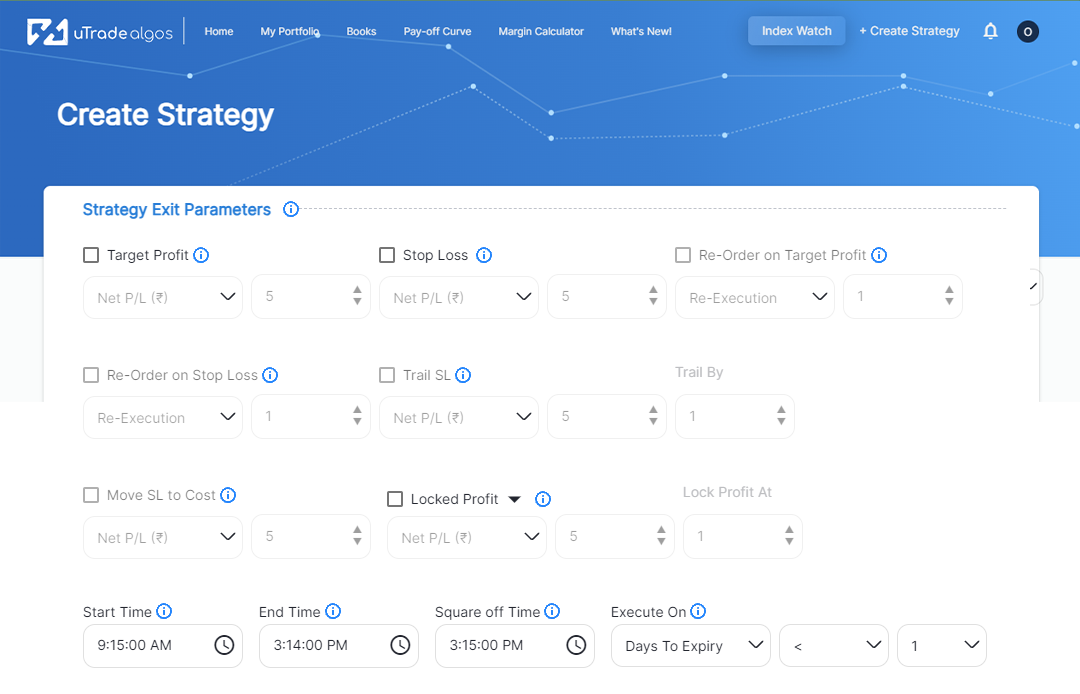
Clearly, that’s not a feasible approach to becoming a successful trader. This is where uTrade Algos can help you automate your trading operations and maintain a continuous watch on the market over its responsible shoulders.
Try out the easy indicator technical study-based entry/exit rule builder today – without writing a single line of code – all on uTrade Algos. Sign up now!


 March 22, 2023


