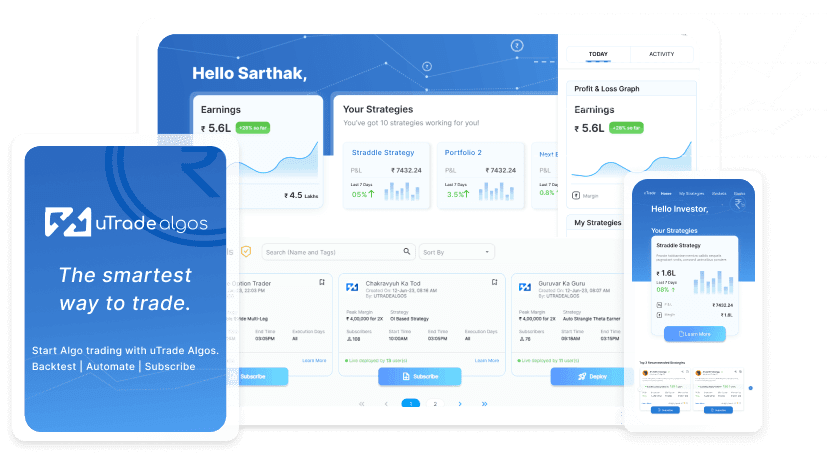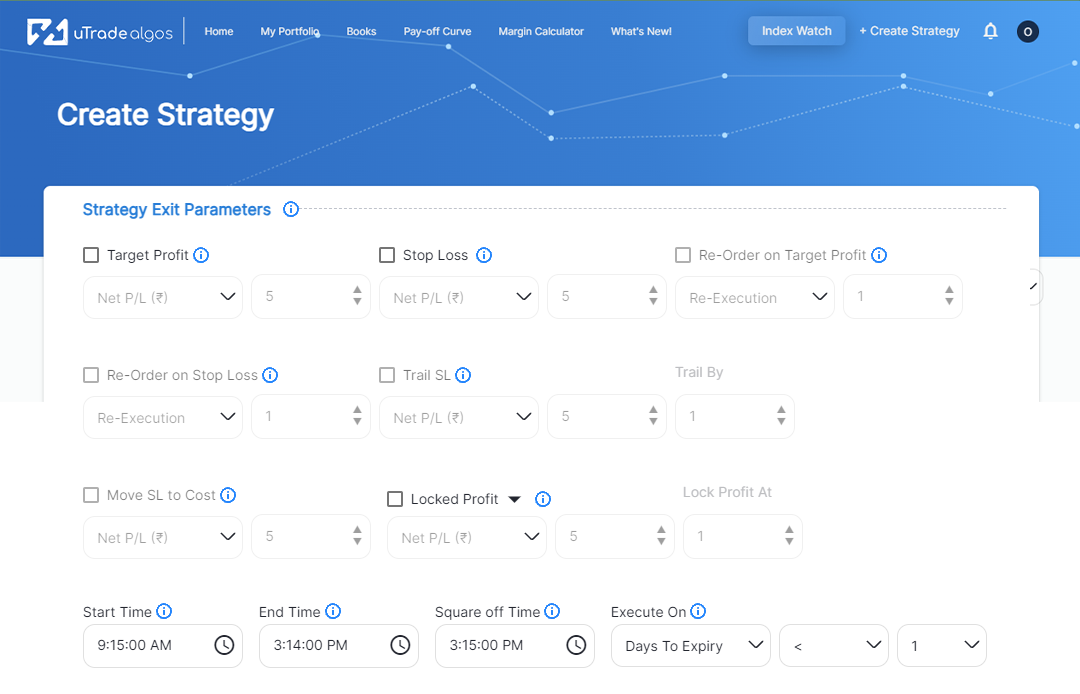
In the ever-evolving landscape of algorithmic trading, on platforms like uTrade Algos, where precision and swift decision-making are imperative, the integration of payoff charts has emerged as a pivotal tool for reshaping trading strategies. These graphical representations of potential profit or loss scenarios offer traders invaluable insights and advantages in navigating the complexities of financial markets. Here we find out the top seven benefits of utilising option payoff charts in algorithmic trading.
Defining Payoff Charts
Payoff charts, also known as P&L diagrams, are visual tools in finance, particularly in options and derivatives trading.
- They display potential profit or loss of a trading strategy at options’ expiration by plotting the relationship between the underlying asset’s price and the net profit or loss.
- These charts offer a clear view of how a strategy might perform across various asset prices, aiding traders in evaluating strategies and making informed decisions.
- They simplify complex strategies’ analysis and help traders understand potential outcomes under different market scenarios.
Benefits of Using Payoff Charts in Algorithmic Trading
1. Visual Representation of Strategies
Payoff charts are graphical representations that offer a clear and intuitive depiction of how a trading strategy may perform under various market conditions.
- They illustrate the relationship between potential profits or losses and the underlying asset’s price at expiration. At uTrade Algos you can leverage option payoff graphs to improve your trading decisions by comprehending how changes in the underlying asset’s price affect your strategy’s profitability. This platform will help you to visualise potential outcomes and select the most suitable strategy tailored to your preferences and risk profile.
- These visuals empower traders to comprehend complex strategies, such as spreads, straddles, or condors, by showcasing how different positions behave at different asset prices and timeframes.
- This visual aid simplifies the understanding of intricate strategies that involve multiple options or derivatives, aiding traders in formulating and implementing their trading decisions effectively.
2. Strategy Evaluation and Comparison
Utilising option payoff charts enables traders to evaluate and compare multiple strategies efficiently.
- By plotting and comparing different strategies on the same chart, traders can swiftly assess their potential outcomes and risk-reward profiles.
- This comparative analysis assists in selecting the most suitable strategy aligned with the trader’s market outlook, risk tolerance, and profit objectives.
- Traders can overlay various charts or adjust parameters to analyse and select the optimal strategy that meets their specific requirements, enabling a more informed decision-making process.
3. Real-Time Decision-Making
Integration of payoff charts with algorithmic trading platforms allows for dynamic and real-time updates based on changing market conditions.
- Traders can observe immediate adjustments in the charts as prices fluctuate, facilitating prompt decision-making. This real-time visualisation empowers traders to react swiftly to market movements, assess the impact of price changes on their positions, and adjust strategies without delay.
- Consequently, traders can capitalise on emerging opportunities or mitigate potential risks promptly, enhancing the agility and responsiveness of their trading activities.
4. Risk Assessment and Management
Payoff charts provide a comprehensive view of potential risk exposure associated with a trading strategy.
- This visual representation aids in risk management by allowing traders to set predefined stop-loss levels, determine position sizes and employ hedging strategies based on their risk tolerance.
- By understanding the potential risks illustrated on the chart, traders can effectively manage and mitigate risks associated with their trading positions.
- uTrade Algos has innovated beyond standard payoff charts with the introduction of Options Chains. This feature simplifies strategy building by adding legs with a single click, considering contract open interest and last traded price (LTP). Additionally, herein you can explore the ease of Combined Payoff, which enables a consolidated view of profit and loss curves for multiple strategies, thus enhancing your decision-making process.
5. Scenario Analysis and Stress Testing
Traders leverage payoff charts in algorithmic trading to conduct scenario analysis and stress testing of trading strategies.
- By adjusting underlying asset prices, volatility levels, or time to expiration, traders can simulate various market scenarios.
- This allows them to stress-test their strategies and assess their resilience under different market conditions.
- Traders can anticipate how their positions may perform in volatile or adverse market scenarios, enabling them to refine strategies, make necessary adjustments, and prepare for a range of potential outcomes.
6. Educational Tool for Traders
Payoff charts serve as educational tools, particularly for novice traders, aiding in the understanding of different trading strategies.
- These visual representations provide a practical way for traders to comprehend the potential outcomes of various strategies.
- By visualising potential profit and loss scenarios, traders can grasp the mechanics of options and derivatives, improving their understanding of complex trading instruments.
- This educational aspect helps traders make more informed decisions and enhances their overall trading acumen.
7. Trade Performance Monitoring
Following trade execution, option payoff graphs assist traders in analysing trade performance.
- Traders can compare the actual outcomes of trades against the anticipated scenarios depicted on the charts.
- This comparison enables traders to evaluate the effectiveness of their strategies, identify any discrepancies between expected and actual outcomes, and pinpoint areas for improvement in their trading approaches.
- By evaluating past trade performance through the lens of payoff charts, traders can refine their strategies, make informed adjustments, and continually improve their trading methodologies.
- Mastering and executing intricate strategies is now more accessible on the uTrade Algos platform. You can use dynamic payoff graphs to evaluate your strategy’s potential and maintain a competitive edge in the market.
Key Cautionary Aspects in Analysing Payoff Charts
- Limited Scope: Payoff charts illustrate scenarios at expiration, not accounting for dynamic changes during the option’s lifespan.
- Assumed Volatility: They often assume a static level of volatility, neglecting potential fluctuations that impact profits.
- Omission of Costs: These charts may overlook transaction costs, affecting actual profits or losses.
- Market Timing: They focus on expiration, disregarding interim market movements affecting profitability.
- Complex Strategies: Interpretation becomes challenging with intricate strategies involving multiple legs or combinations.
- Risk Misinterpretation: Traders might misjudge risks as charts often depict the best-case scenario, not worst-case losses.
- Assumptions on Underlying Asset: Charts assume asset availability and liquidity, potentially differing from real market conditions.
- Sensitivity to Parameters: Small changes in input variables like volatility or time to expiration can significantly alter outcomes portrayed in charts.
Payoff charts in algorithmic trading offer traders a multitude of advantages in analysing, evaluating, and optimising trading strategies. As technology advances, the refinement and utilisation of payoff charts continue to revolutionise algorithmic trading, providing traders with a competitive edge in dynamic and evolving market environments.

 January 7, 2024


